What is Latency in Networking?

Latency is the delay or time it takes for data to travel from its source to its destination. Therefore, low latency describes a computer network that processes high volumes of data with minimal delay.
Network latency can impact everything from email and file transfers to cloud services. In real-time communication, high latency can cause lag, making conversations choppy and ineffective, which can disrupt critical business meetings.
Examples of latency in corporate networks
A real-life scenario where network latency can affect business efficiency is when sensors on factory equipment send data to a central system for real-time monitoring and analytics.
If the network latency is high, the data delay could lead to inaccurate readings, delayed decisions, and even machinery malfunction.
API integration is another area where low latency is crucial. Computer systems that communicate through an application programming interface (API) often halt system processing until the API responds.
Imagine a flight-booking website using an API to check seat availability. High latency could slow the website, potentially preventing you from booking your flight.
Streaming analytics applications, like real-time auctions, online betting, and multiplayer games, also depend heavily on real-time data. Users in these cases rely on accurate, timely information to make decisions. A delay could mean financial losses.
Four types of network latency
- Propagation delay
Propagation delay is the time it takes for the head of a signal to travel from the sender to the receiver, which depends on the propagation speed and distance. When sending a message from one computer to another, propagation delay is the time it takes for your message to arrive.
We can measure propagation delay by dividing the distance (d) by the speed (s) of the signal. For example, in wireless communication, \( s \) is the speed of light, denoted as \( c \). In copper wires, the speed ranges from 0.59c to 0.77c. This delay is a big challenge in developing high-speed computers and is known as the interconnect bottleneck in IC systems.
- Transmission delay
Transmission delay defines the time it takes to transfer data bits over a wired or wireless network. It is influenced by the network's bandwidth and the length of the data packet.
If a data packet is 20 bits long and the bandwidth of the data line is 1 bit per second, the transmission delay will be 20 seconds.
- Processing delay
Processing delay measures the time it takes routers to process the packet header in a network based on packet switching. Routers might check for bit-level errors during packet processing and determine the packet's next destination. These delays are generally in microseconds or less for high-speed routers.
If a router receives a data packet, it must inspect the header to check for errors and decide where to send it next. This inspection and decision-making take time, adding to the overall network delay.
A typical scenario where processing delay can become significant is where complex encryption algorithms are applied to data packets. This is particularly true for routers that perform deep packet inspection (DPI) or network address translation (NAT).
- Queuing delay
Queuing delay happens when packets are lined up waiting to be processed or transmitted. It can occur at various points in a network, but it's most noticeable at routers and switches.
We can explain queuing delay with the analogy of a busy coffee shop where the barista can only handle one order at a time. If five people arrive simultaneously, the fifth person has to wait for the first four to get their coffee. That wait time is similar to a queuing delay in computer networking.
Queuing delay is influenced by the network's traffic load and the capacity of the involved devices. A practical scenario is a router that can process 1,000 packets per second.
If the router suddenly receives 2,000 packets in one second, 1,000 packets will be queued, waiting their turn. This queue builds up as packets keep arriving.
Causes of network latency
- Network congestion
Network congestion happens when the network capacity can't handle the volume of data being transmitted. Routers and switches start queuing up packets. If the queue gets too long, latency increases and new packets are dropped.
When TCP detects packet loss, it slows down the data transmission rate. This helps reduce congestion but also introduces more latency. Visualize it as slowing your car to avoid adding to the traffic jam.
Congestion isn't just about too much data. Network design, inadequate infrastructure, and even hardware limitations can contribute. Switching to higher bandwidth, using Quality of Service (QoS) settings, or upgrading network hardware can help.
- Physical distance
Latency is heavily influenced by physical distance. The farther data has to travel, the more time it takes. Suppose you are working from a server in New York, and your client is in Sydney, Australia. Data has to traverse thousands of miles, crossing several networks.
The ping time could increase to 200-300 milliseconds due to the greater physical distance.
- Routing and switching delays
When a data packet travels from one network node to another, it might pass through multiple routers and switches. Each device introduces a delay.
Routing delays occur because routers must examine the packet header and decide the best path for it. They must perform a lookup in their routing table, which takes time. If the routing table is large, the delay can be noticeable.
Switching delays occur within switches, primarily at the data link layer. Switches forward packets based on MAC addresses and maintains a MAC address table to decide which port to forward the packet to. Similar to routing, a large MAC address table can increase delay.
- Network hardware limitations
The quality and capability of the devices you are using can impact latency. For example, an outdated router or switch that does not support the latest protocols or faster data transfer rates can drastically reduce network speed.
To illustrate the above example with numbers, if your router only supports 802.11g Wi-Fi, the maximum speed you can get is 54 Mbps. Compare that to the latest 802.11ac or 802.11ax (Wi-Fi 6), which can handle gigabit speeds. Upgrading your router can significantly reduce latency, especially in an office setup with multiple devices.
Another factor is the use of hardware firewalls. While these are essential for security, they can introduce additional latency if not correctly configured.
Cheap or underpowered firewalls may struggle with high traffic loads. For instance, a firewall that can't handle more than 200 Mbps of throughput will become a bottleneck on the network if you're on a 500 Mbps internet connection.
These settings increase the TCP receive buffer size and adjust driver buffers, helping to push more data through the firewall more quickly.
Switches also play a significant role. Managed switches offer Quality of Service (QoS) features that can prioritize traffic, reducing latency for critical applications like video conferencing or online gaming. However, unmanaged switches lack these features and may cause network congestion.
Lastly, consider your Ethernet cables. Cat5e cables support up to 1 Gbps speeds, while Cat6a can go up to 10 Gbps over short distances. If you're using old Cat5 cables, upgrading to Cat6 or Cat6a can reduce latency and improve overall performance.
- Interference and noise
Interference happens when unwanted signals overlap with the signals we actually want. These unwanted signals can come from various sources.
For example, if you're using Wi-Fi in a shared office space, your neighbor's Wi-Fi can interfere with yours. This is because most Wi-Fi networks operate on similar frequency bands.
Noise refers to random, unpredictable electrical signals that can corrupt data. This noise can come from many sources, including electrical appliances, power lines, or the weather.
For instance, a repair crew fitting security screens can generate noise that interferes with Wi-Fi signals, corrupting the transmitted data. Your Zoom video call may start buffering when they run their angle grinder or drill.
Measuring and diagnosing network latency
Ping
Ping measures how long it takes for a computer to send a request to another over a network and wait for its reply. To use Ping, you can open your terminal or Command Prompt and type something like this:
That script sends several packets to Google's server, and you'll get this back:
The above example shows the time each packet took to make round trip time. The time is shown in milliseconds (ms). The times are consistent, ranging from 14ms to 15ms. This low latency is what you'd expect from a robust, well-maintained server like Google's.
Traceroute
Traceroute is an essential tool for diagnosing latency issues. It works by mapping the path your data packets take to reach their destination. It lists all the intermediary steps, or "hops", between your computer and the target server. This way, you can pinpoint exactly where the delays are happening.
Running `traceroute` sends out a series of packets with increasing Time-To-Live (TTL) values. The first packet has a TTL of 1, the next has a TTL of 2, and so on. Each router along the path decrements the TTL by one.
When a router gets a packet with a TTL of 0, it sends back a "Time Exceeded" message. This lets `traceroute` know the packet reached that router. By piecing together these responses, `traceroute` maps your packets' route.
Let's illustrate how Traceroute works with a quick example. Suppose we want to trace the route to `google.com`. We'd open our terminal and type:
Running that command gives you a list of hops, each with its own latency. Here's a simplified version of what the output might look like:
Each line represents a hop. The numbers at the end show the round-trip time (RTT) for the packet to reach that hop and return. If you see a huge jump in latency between two hops, that might be where the problem is.
However, `traceroute` isn't perfect. Sometimes, a router might not respond to `ICMP` packets, which `traceroute` uses by default. In such cases you will see an asterisk `*` instead of a latency value.
How Netmaker Helps
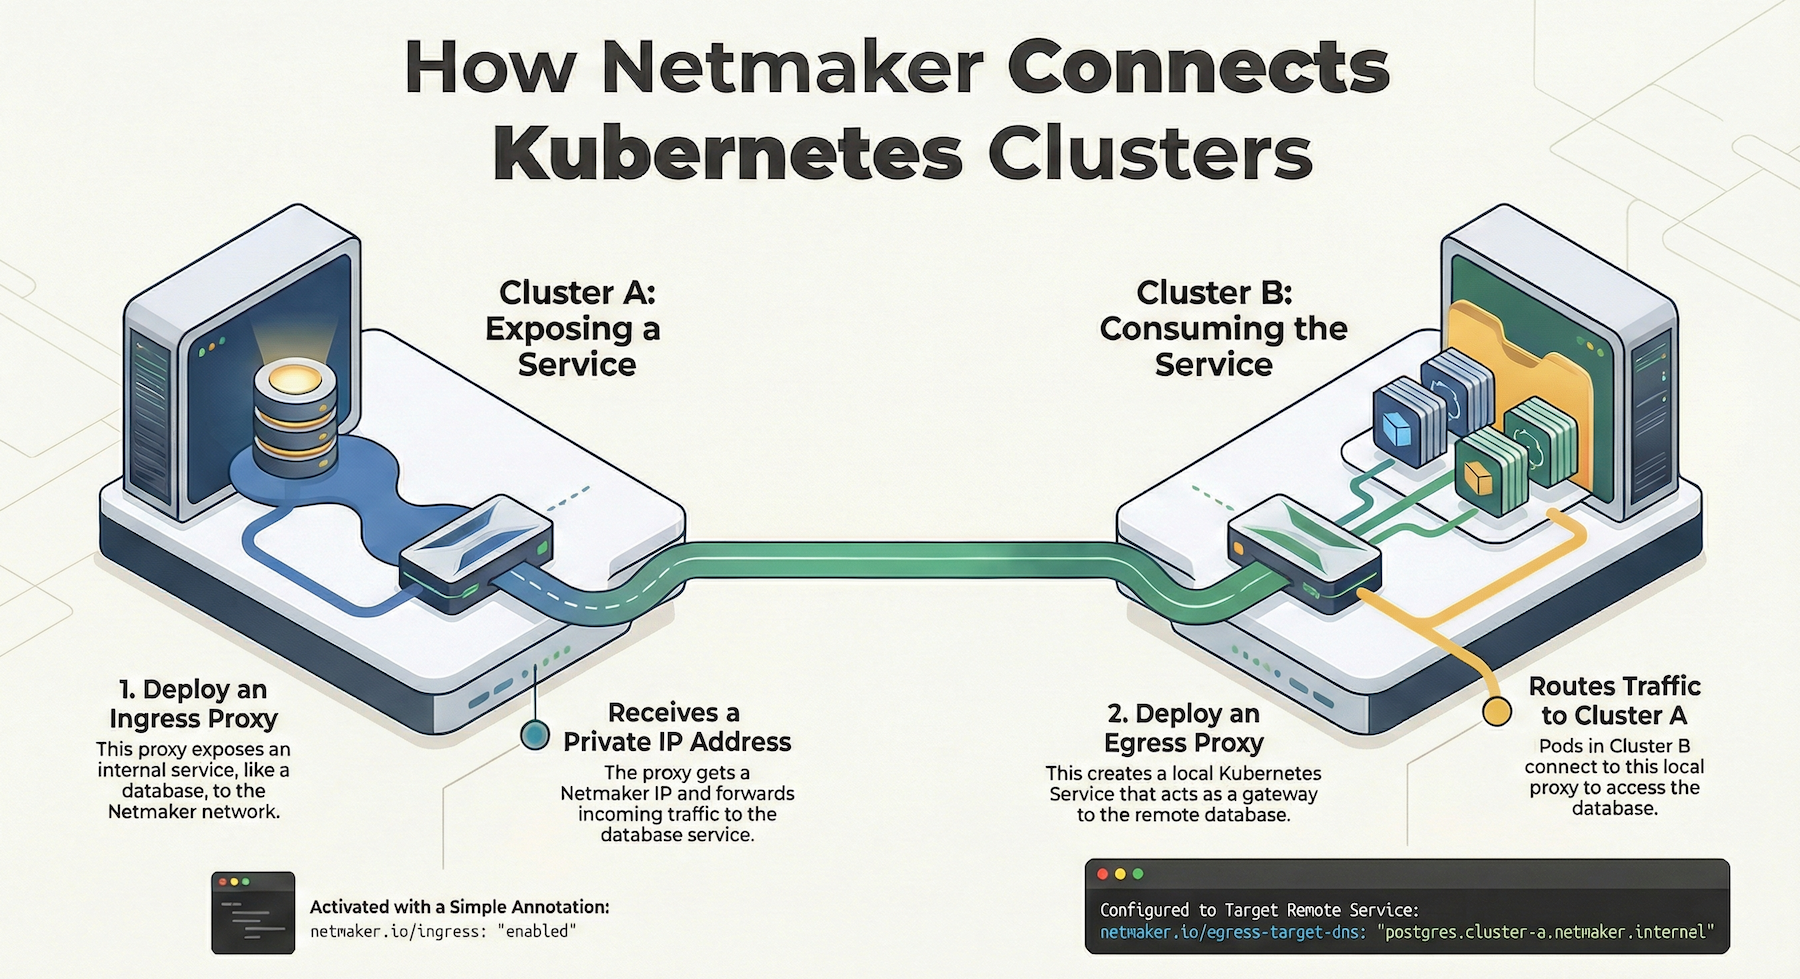
Netmaker offers robust solutions to address network latency issues, a critical concern in real-time applications such as factory equipment monitoring, API integrations, and streaming analytics. By creating secure, virtual overlay networks, Netmaker ensures efficient data transfer across disparate locations, significantly reducing latency. Features like site-to-site mesh VPNs allow businesses to link multiple sites seamlessly, providing a cohesive network environment that minimizes propagation and transmission delays. This is particularly beneficial for real-time monitoring in manufacturing, where data integrity and timely decision-making are paramount.
Additionally, Netmaker's integration with WireGuard allows for fast, encrypted tunnels, reducing processing delays associated with deep packet inspection or encryption algorithms. The use of Egress Gateways and Remote Access Clients further optimizes network efficiency by allowing external clients to connect to the network with minimal queuing delays. These capabilities ensure that applications requiring real-time data, such as flight booking systems or multiplayer gaming platforms, operate with lower latency, thus enhancing user experience and operational efficiency. To start leveraging these features for improved network performance, businesses can sign up for Netmaker here.
.svg)


.svg)